Measured energy

You don’t need to fill a plant room with sensors to understand how it works. Six well-chosen readings, looked at together, tell you how efficient the heat source is, where energy is wasted and whether an upgrade has paid off.
Heating plant monitoring is often the first step towards improving a system, and often the one that gets skipped. The boiler is replaced, a heat pump is added, the controls are redone, and in the end nobody can say with numbers whether things got better.
The reason is not the cost of the instruments, which is modest. It is that it is not clear what to measure. In this article we suggest six readings, the minimum needed to understand how a plant room works, and explain how to read them together.
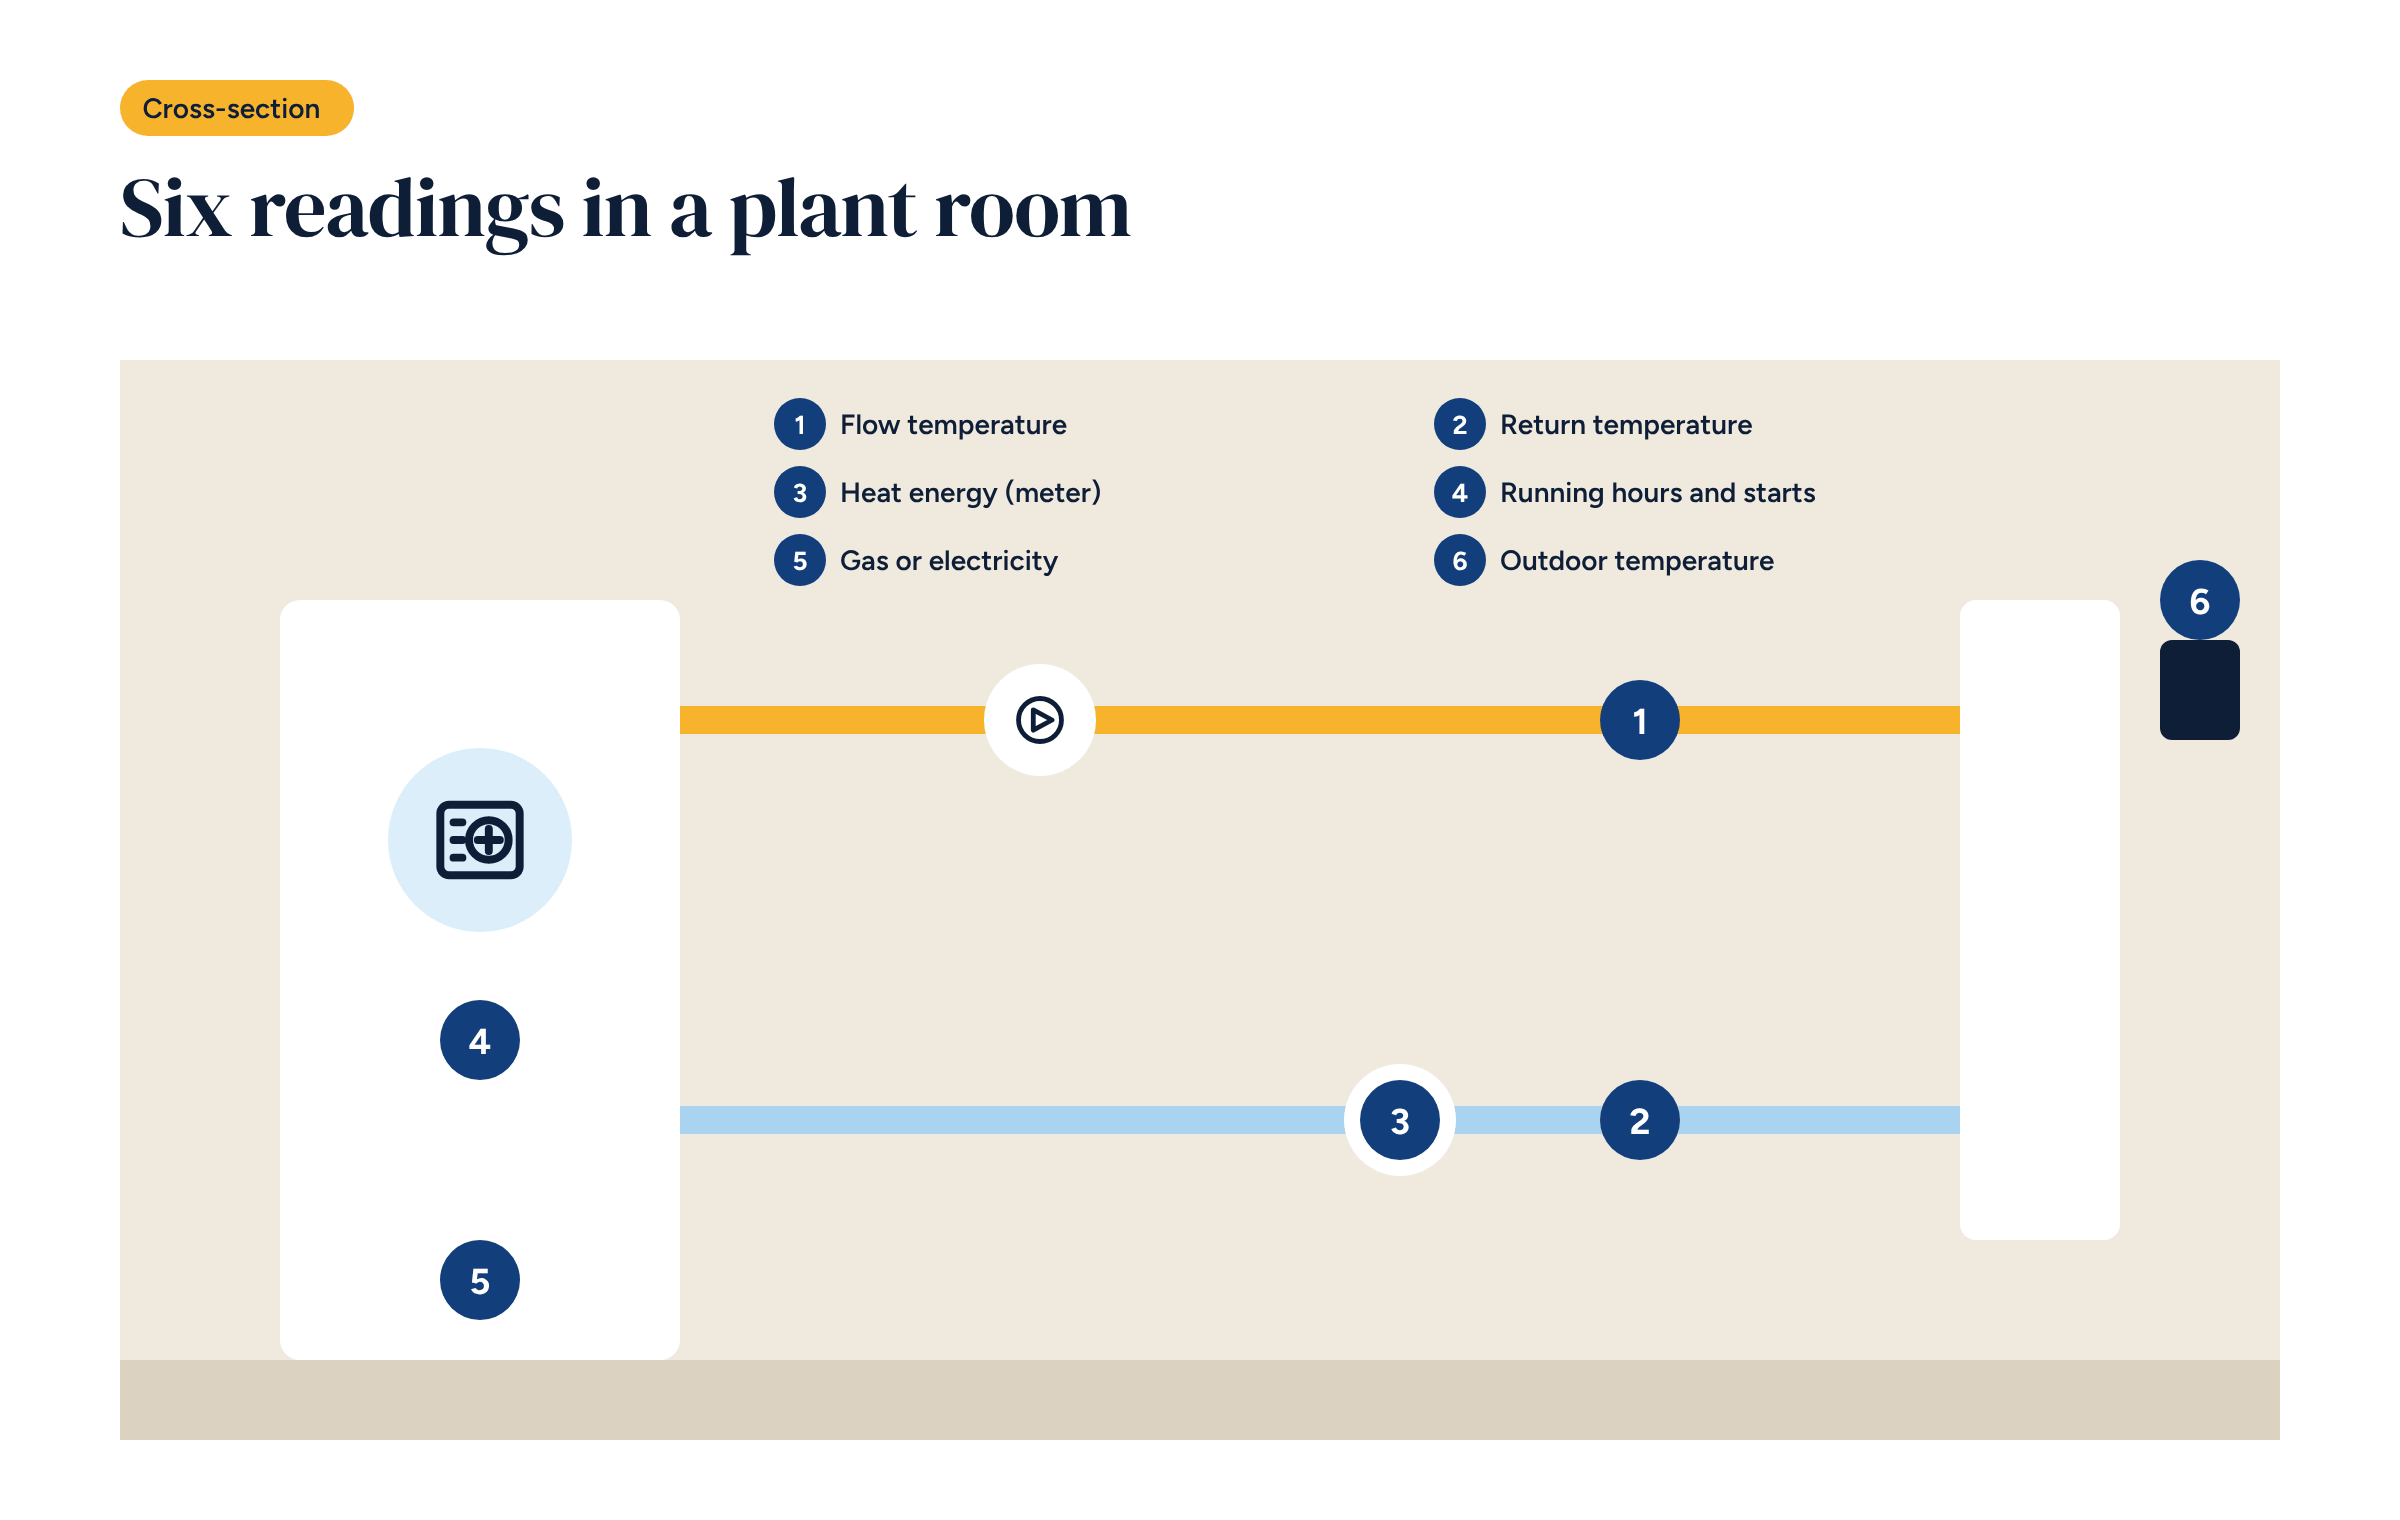
The temperature of the water leaving for the system. It is measured downstream of the heat source and, where there are mixed circuits, downstream of each mixing valve.
It tells you whether weather compensation is working: the flow should follow the curve, drop when it is less cold outside and stay stable without hunting. A flow temperature that is always high, even on mild days, is the most common sign of a system using more than it needs.
How to measure it. With an immersion sensor in a pocket, or a strap-on sensor with thermal paste and insulation. An uninsulated strap-on sensor can read two or three degrees low.
The temperature of the water coming back from the system. On its own it says little; together with the flow it says a great deal.
The difference between flow and return, the temperature difference or delta-T, shows how much heat the emitters are giving off. A delta-T that is too low, say 2 °C in a system designed for 5 °C, means excessive flow: pumps running harder than needed and, with a condensing boiler, a return too warm to condense. Condensing boilers work best with returns below about 50 °C, and much better below 40 °C.
The heat actually delivered to the system. It is measured with a heat meter, which combines a flow meter and a pair of sensors on flow and return.
It is the most expensive of the six readings by some margin, but it is the one that lets you calculate the heat source’s real efficiency: heat produced divided by energy consumed. For a heat pump, it is the way to know the real COP, day by day, instead of the catalogue figure.
Without a heat meter, you can estimate heat from the pump’s nominal flow and the delta-T. It is a rough estimate, but better than nothing.
How many hours a day the heat source runs, and how many times it starts. These come from a status contact on the heat source, or from its data over Modbus where available.
Starts are a valuable and neglected indicator. A heat source that starts fifty times a day for a few minutes each time is working badly: it is oversized, its hysteresis is too tight or its curve too high. Short cycles use more energy and wear out components.
The energy going into the plant room. For a boiler you measure gas; for a heat pump, electricity.
For gas, the simplest route is a meter with a pulse output, which is common: each pulse corresponds to a fixed quantity, for example a hundredth of a cubic metre. The controller counts the pulses and calculates consumption.
For electricity, use a meter dedicated to the heat pump, ideally with a Modbus output that also gives instantaneous power. The building’s main meter is not enough: it mixes the heat pump with everything else.
Without the outdoor temperature no consumption figure can be judged. A mild January uses less than a cold one, however good the system.
From the outdoor temperature you calculate degree days, a measure of how cold it has been, and compare different periods on an equal footing. The sensor is often already there for weather compensation: it just needs logging.
The six readings become useful when you combine them. Three views work for almost any system.
Efficiency. Heat energy divided by gas or electricity, day by day. For a heat pump, plotted against outdoor temperature, it shows at once whether the system performs as expected.
Energy signature. Daily consumption plotted against the day’s average outdoor temperature. The points fall along a line: a successful upgrade moves it down. It is the simplest way to demonstrate a saving, and to spot a deterioration.
Hourly behaviour. Flow, return and heat source status over a day. It shows short cycles, needless night-time starts and flow temperatures that are too high in the warmer hours.
These are the same views behind the Grafana plant room dashboard we described, and the method for measuring the savings from zone control.
In a small apartment block with a central boiler, the first weeks of readings often show the same picture: flow at 70 °C even with 12 °C outside, return at 62 °C, dozens of starts a day. Translated: no heating curve or one set too high, excessive flow, a boiler that never condenses. Three corrections that cost little, and that without readings nobody would ever have known were needed.
Of the six readings, four are cheap: the flow, return and outdoor sensors and the heat source status contact. The pulse gas meter is often already there, or can be swapped cheaply. A dedicated electricity meter costs little. The heat meter is the biggest item, and can be added later.
For buildings aiming at building automation standards or incentives, metering is also a requirement: as we saw in the article on class B requirements, the system has to report consumption to the building’s users.
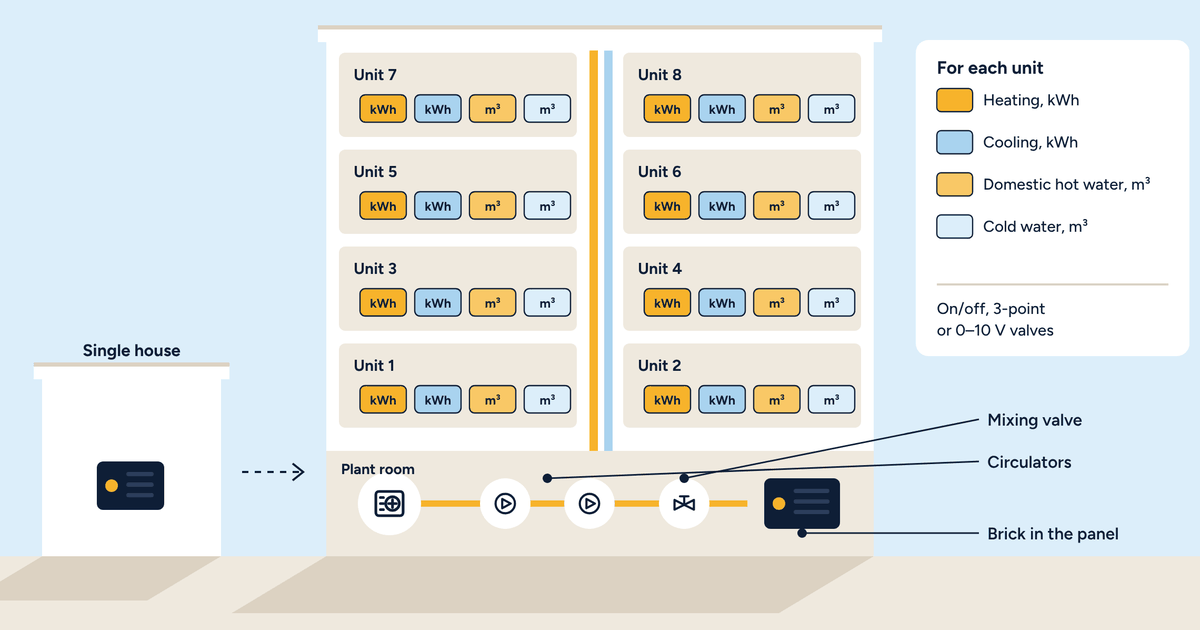
Brick has inputs for temperature sensors, digital inputs for status contacts and pulse meters, and an RS-485 port for Modbus meters and heat sources. All the readings go into the same database on the controller and appear in Grafana alongside zone temperatures. None of them pass through an external service.
Sensors, pulse meters and Modbus meters connect to the controller, and the data goes into Grafana with no external services.